The reason why there’s all the confusion over Cameron’s comments on pensioner benefits is in this table
Electorally the Tories can’t upset the oldies
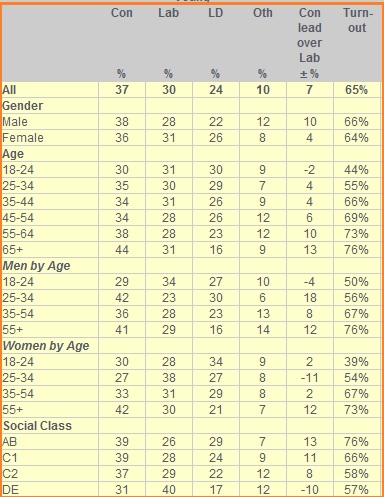
The above table was produced by Ipsos-MORI and published shortly after the GE2010. It shows the demographic breakdown of how Britain voted.
The key numbers are for the older age groups – the pensioners. Not only were they the most likely to turnout they were the most Tory.
If you are facing an election sixteen months time you have to think very carefully before doing anything negative to your key voting group.
Increasing life expectancy will see this segment grow bigger in years to come.
If other age groups want to be more influential politically the table provides the answer – go out and vote.