Opinion polls and local elections

I wrote a thread header a few weeks ago which covered the correlation between opinion poll voting intentions (VI) and general election results. I found that there is a strong relationship between VI and general election results, though the small size of the sample of eleven general elections on which I based the work meant that my conclusion was tentative.
Given that we have a large number of council and other polls coming up in May, I thought it was a good time to ask the same question for local elections. As we have one set of local elections every year, there are far more observations, so the conclusions will be more robust. But, on the other hand, the opinion poll questions are about national, not local, elections, so there could be significant differences if people vote different ways in different elections.
Conclusion
I have concluded that national opinion polls give a robust forecast of local election results, although slightly less so than general election results. The main exception was during the years 1998-2004, when Labour’s high popularity in national VI polls (and the Conservatives’ unpopularity) was not reflected in local election results. For the 2021 local elections, a solid Conservative lead in the national polls will probably produce a solid but not spectacular lead in the projected national vote estimate, though because some of the seats were last contested in 2017, a very good year for the party locally, they may lose councillors overall.
Those not interested in statistical methodologies and detailed results can skip the remainder of this article.
As ever, thanks to the other pbers who have commented on this thread.
Data sources
To work out the correlation between national VI and local election results, I used IPSOS MORI data for the VI, and the national equivalent share of the vote published by John Curtice and published here to 2015 (and available on the BBC’s website for subsequent years) for the local election results.
I have used the standard R2 statistic as before. As a reminder, this measures the extent of the relationship between two variables. An R2 of 0 means that they are unrelated, 1 means a perfect relationship, and 0.7-1 is generally taken to mean a strong relationship. See Graph 1 below.
As a reminder, the correlation between the general election result and the last VI poll before the election was 0.9 – a very high result. As you can see from Graph 1, for the local elections, the relationship is much weaker, at 0.5. Indeed, this is below 0.7, the level at which a relationship is probable.
Outliers
However, looking at Graph 1, above, the result is heavily influenced by the five years in which the Conservatives were 20% or more behind in the polls, but -10% to +10% ahead in the local election results (roughly, those dots at the bottom of the chart and in the middle). These are concentrated in the years 1998-2004, when New Labour was very popular at a national level, but evidently less so locally. Eliminating those years from the data shows a much stronger relationship between voting intention and local election results, as shown in Graph 2 below.
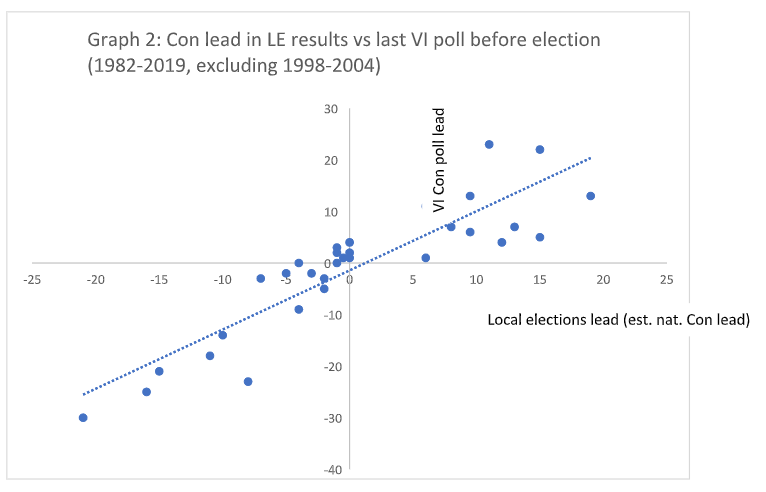
Even a glance at Graph 2 shows a much more convincing relationship between the two variables, and this is borne out by the R2 statistic, which increases from 0.5 to 0.8, indicating a strong relationship rather than a weak, or non-existent one. Elimination of outlying data will, of course, always improve a relationship, but in this case the outlying data is largely concentrated in one time period – Tony Blair in his pomp. Interestingly, it does not apply to the period when Tony Blair was in Opposition to John Major – the poll leads were just as big, but these were reflected in excellent results in local elections for Labour. After Blair became Prime Minister, this relationship vanished, and local politics was much more competitive, though Labour still dominated the national stage. (For completeness, the other outlying years were 1990, 1992 and 2017, each of which has its own story).
Implications for the 2021 elections
What does this mean for the 2021 local elections in England and Wales (Scotland is clearly different)? The situation does not appear comparable to the 1998-2004 period, where one party dominated nationally, so we may assume that the relationship should hold this year. The Conservatives have a significant and consistent lead in the polls – if we assume a lead of 6-7%, this would imply a similar advantage in the estimated national vote share. So I would expect the 2021 local elections to be good but not stunning for the Blues. Eighteen months into the fourth term of a government, that is surely an achievement in itself?