Betting on another CON majority – Part 2

This is the second part of a thread on estimating Conservative seat numbers at the next election. It contains statistical analysis: those not interested can skip to the Conclusion.
Model
The data in the previous part of this thread does seem to support our hypothesis that extreme results for the Conservatives are unlikely: in all bar one of the twenty-two elections, they have won between 25% and 75% of the seats, and in fourteen of them, their share has been between 40% and 60%. This would immediately suggest to a statistician that their share of seats could be normally distributed, in other words, it is a “bell curve”. There will be an average (a mean, or ?), and two-thirds of results will be within a certain number of percent (the standard deviation, or ?) of the average. 95% of results will be within 2? of the average (see below).
Fig 1: Normal distribution with generic probabilities
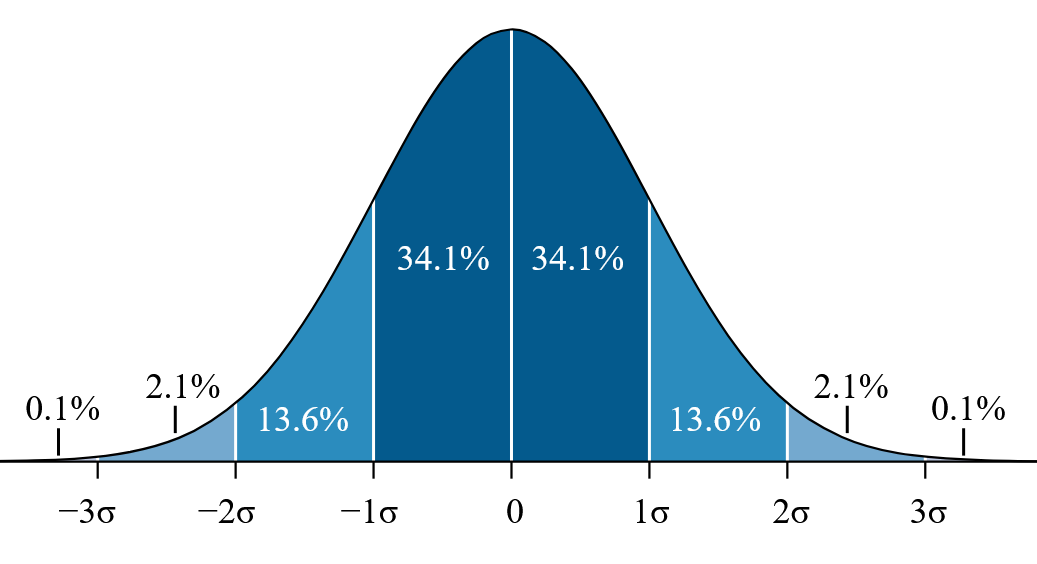
Source: Wikipedia
Does the data of Conservative election results over the past century follow this pattern? One way to test this is simply to plot a graph like Fig 1 with our data, and compare it to Fig 1. It may seem crude, but this is probably the most common way to determine whether data is normally distributed. See Fig 2 below.
Fig 2: histogram of Conservative general election shares against idealised normal distribution curve

While the curve is not a perfect fit, it seems likely that the Conservative general election shares are approximately normally distributed.
A more rigorous statistical test to determine how well data fits to a normal distribution curve is the Shapiro-Wilk test. Without going into too much detail, it tests a null hypothesis that the data is normally distributed. The critical value for n=22 is 0.91. The value of the statistic for our data is 0.95. Since 0.95>0.91, we do not reject the hypothesis at the 95% level. In other words, the data is likely to be normally distributed.
Conclusion
The analysis in both parts of this article suggests the following conclusions:
- the Conservative share of seats at general elections over the last century seems to be approximated by a normal distribution, with a mean of just less than 50%, and a variance of around 13%;
- from this analysis, without taking into account either ‘events’ or ‘personalities’, the likeliest outcome is that they win very slightly fewer than the number of seats needed to win an overall majority, at 49.5%. Since the Sinn Feiners do not take their seats, this might translate into a very small majority, but this could not affect winning a bet;
- there is a 68% chance that they will get between 37% and 63% of the seats, in other words between a majority of 170 and falling equally short;
- however, because the extreme circumstances which often generate landslide majorities (World Wars, Great Depressions, political geniuses) do not seem to exist, this could overestimate the probability of extreme results.
Betting implication
So, based on the historic record, and ignoring ‘events’ and ‘personalities’, it seems likely that the markets are understating the chances of a Conservative victory at the next election. Rather than a 36% chance, the 50% chance that the markets were projecting earlier this year seems to fit the historical data better. Markets overreact, and the recent relatively poor performance of the government could be influencing the betting unduly.